01
Digital entry point on the provider’s website
The PV check is embedded in the provider’s website. Prospects draw their own roof and receive an initial assessment; the sales team gets structured data instead of an empty contact form.
Evidence instead of assertion: the figures below come from the ongoing operation of one specific site.
At one site, PV, battery storage, a heat pump and both AC and DC charging infrastructure are brought together under a shared control logic. The aim of the control system is continuous operation with prioritisation, not hard shutdown when load peaks occur.
Example of this specific site. All values refer exclusively to this reference site and are neither a general market claim nor a commitment for other projects. The ratio of roughly 1:17 between installed charging capacity and grid connection is a site-specific reference. Technical feasibility, device compatibility and achievable values are assessed individually in every project.
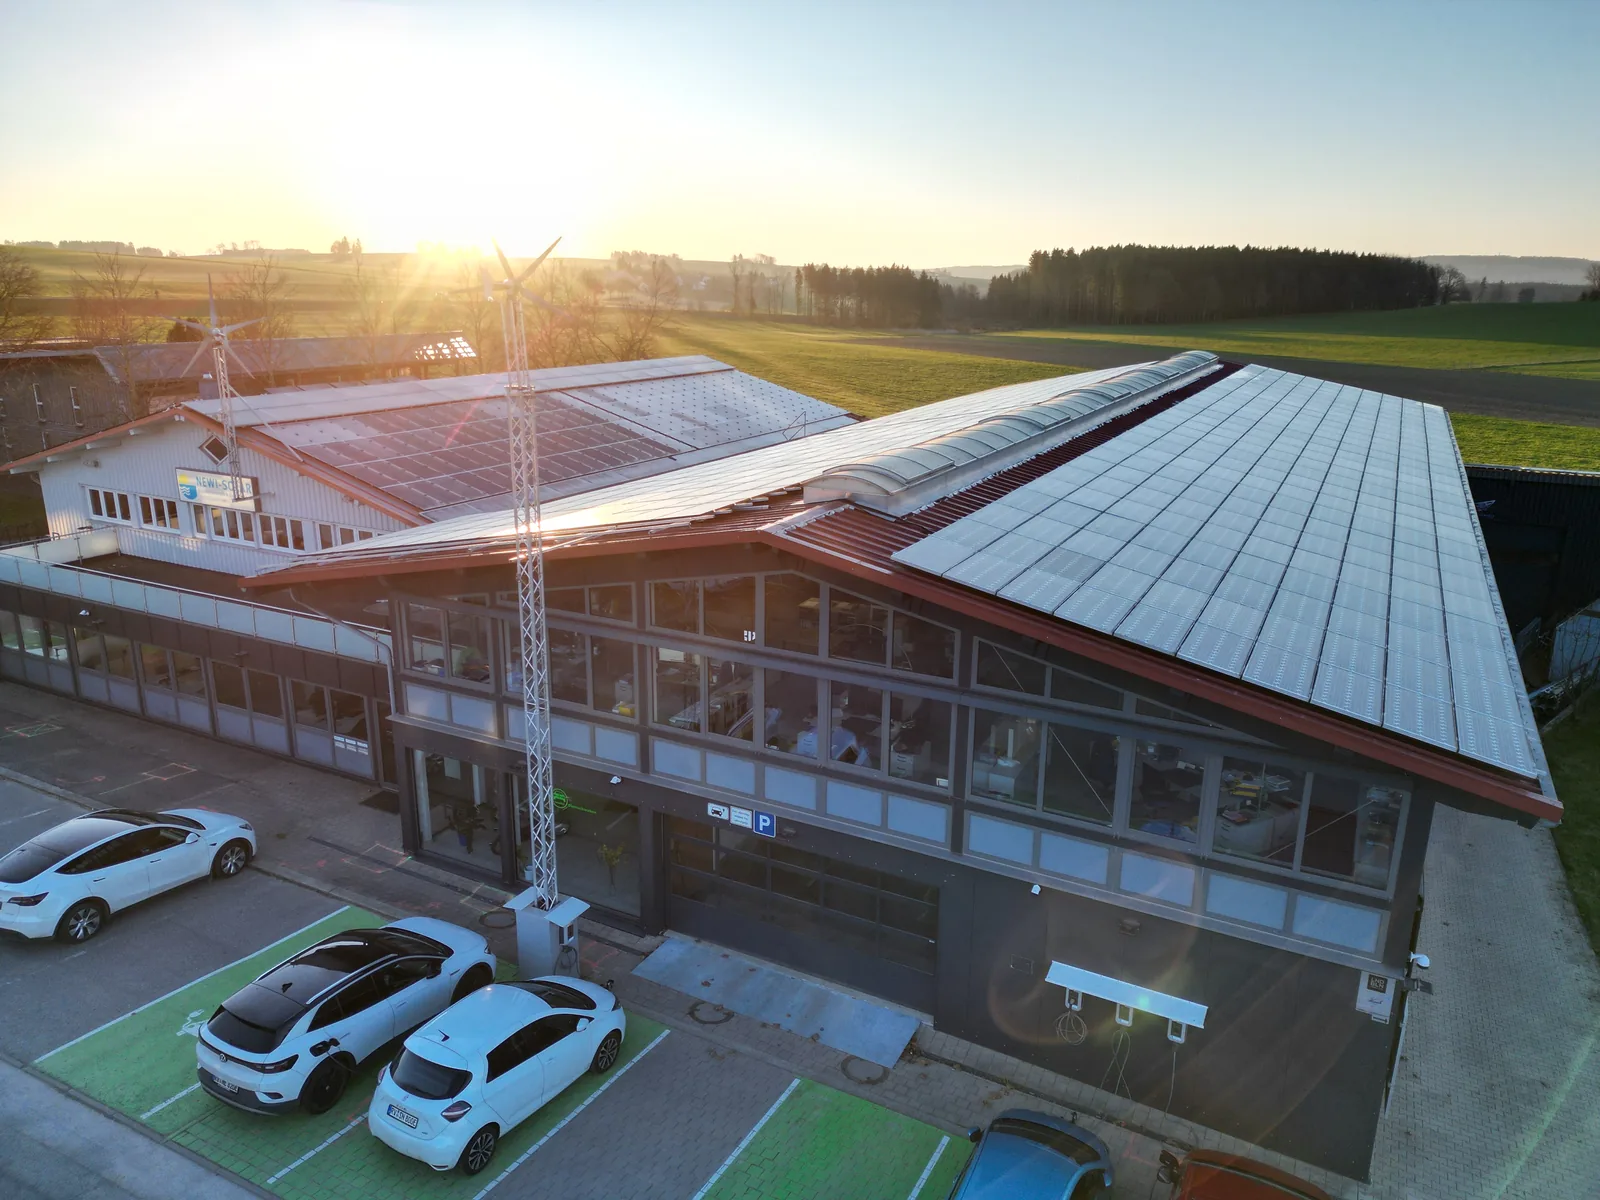
The site has 100 kW of grid connection capacity. The planned charging infrastructure exceeds this many times over. Reinforcing the connection was not the route chosen.
Instead, PV, battery storage, a heat pump and both AC and DC charging infrastructure were brought together under one shared control logic. The 1C storage absorbs load changes within a very short time, and grid-side power is actively limited to the available connection capacity.
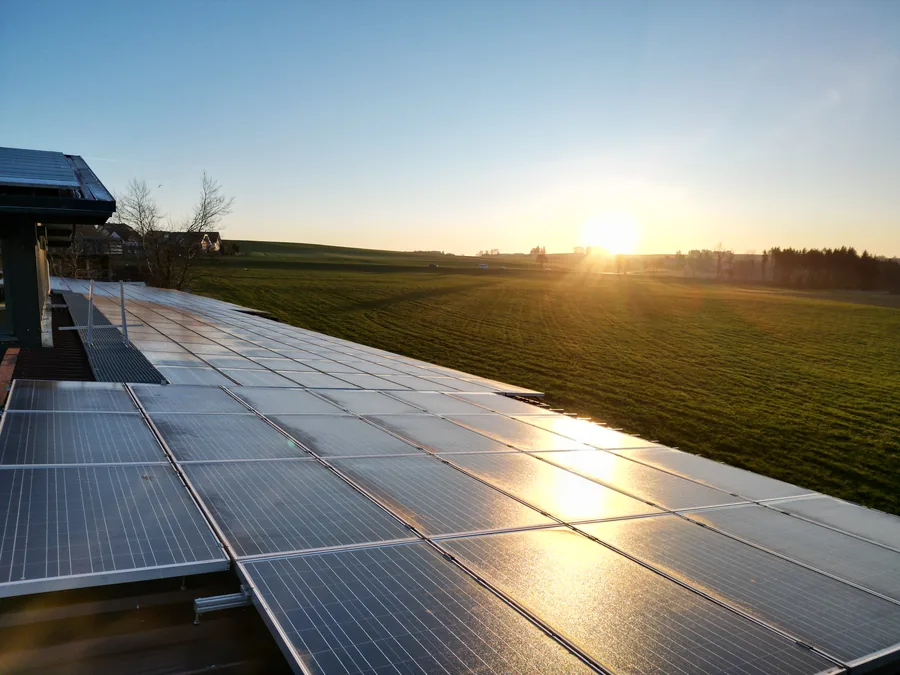
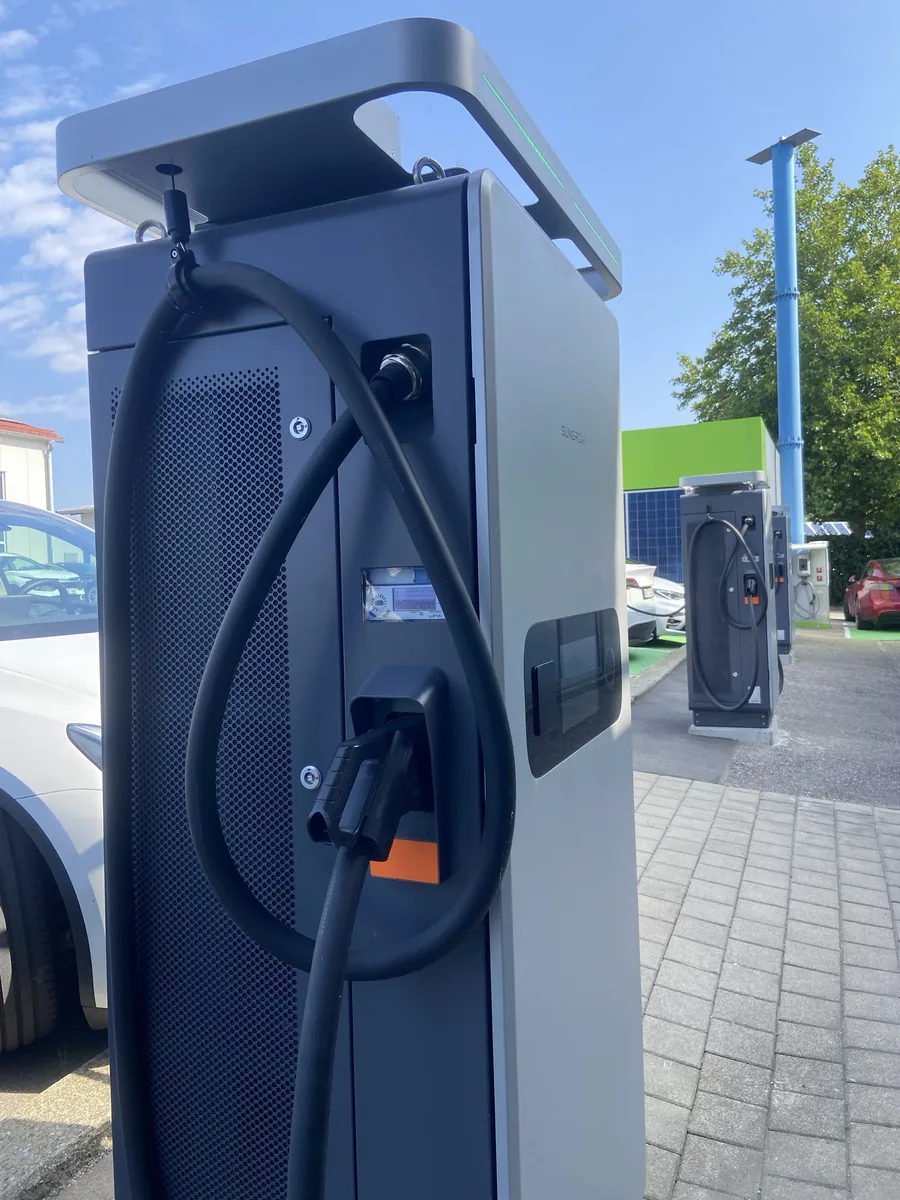 DC charging infrastructure
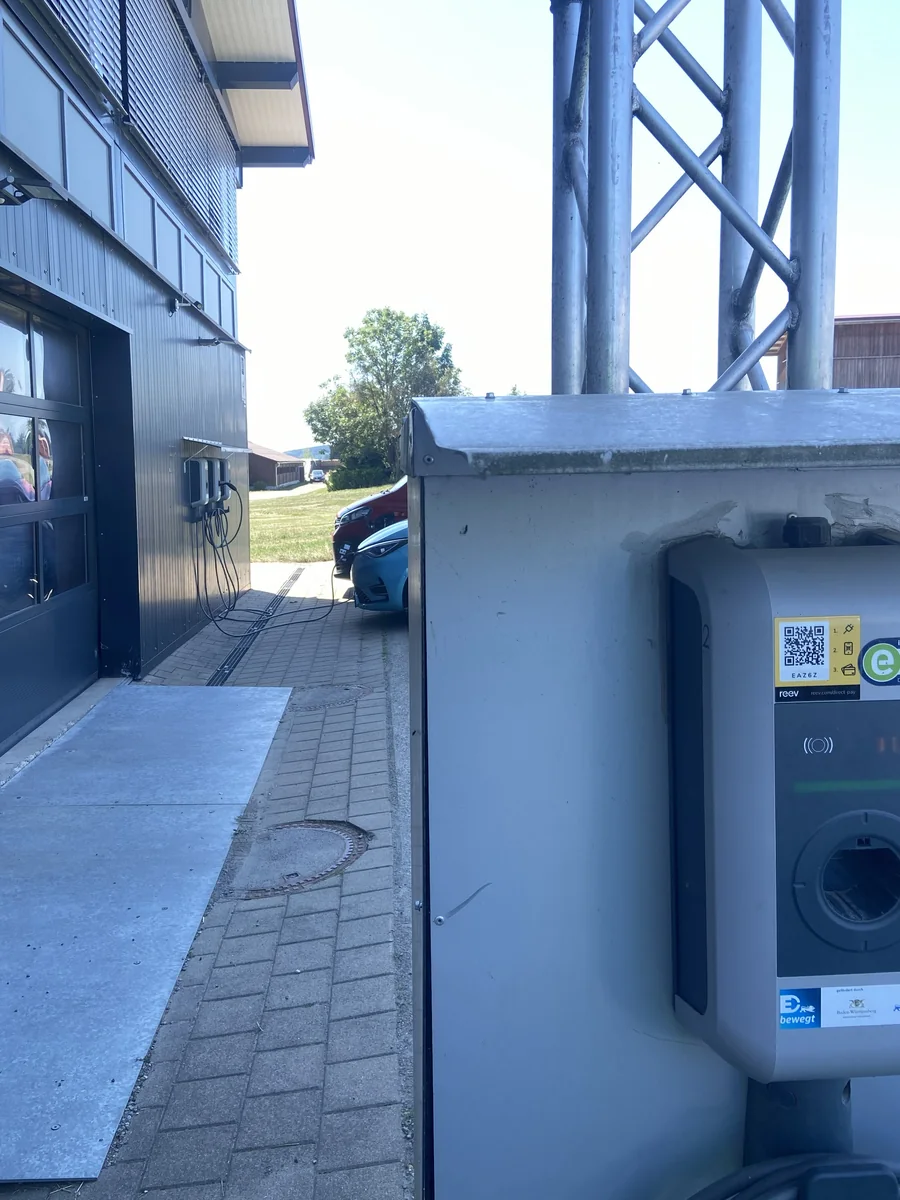 AC charging infrastructure
Real operating data shows grid draw and feed-in between −14 kW and +86 kW while several DC charging points were charging in parallel. The charging infrastructure with 40 points in total – 32 × 22 kW AC and 4 × 180 kW DC – continues operating without the grid connection being exceeded.
Operation and analysis run through a dedicated web GUI with in-depth technical analysis.
Reference site with 340 kWp PV, 723 kWh battery storage and 40 integrated charging points. Images: NEWOLUTION GmbH.
The photovoltaic software has been on the market as an online PV calculator since 2016 and is used by installers, sales organisations and energy service providers.
The PV check is embedded in the provider’s website. Prospects draw their own roof and receive an initial assessment; the sales team gets structured data instead of an empty contact form.
Teams at different sites work from a shared data basis, which keeps quotation quality and calculation assumptions comparable.
The solution runs in the visual identity of the respective provider, embedded in their existing website and processes.












Deliberately without percentages or savings promises. We will add quantitative figures once they are properly defined and evidenced.
Grid-side power is limited to the available connection capacity and allocated by priority instead of switching loads off wholesale.
Critical loads such as production equipment, heat sources or defined charging points keep priority without exceeding the grid limit.
The supervisory control layer does not depend on hardware manufacturers' remote access.
Logging and monitoring make plant state and faults analysable after the fact.
No two projects are alike. Let's assess together which parts of this reference are transferable to your situation.